- Svet
- »
- US
- »
- Kentucky
- »
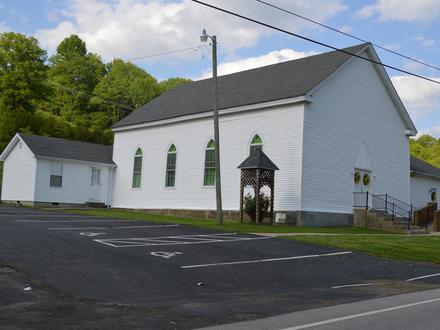
- Willisburg, Kentucky
Podjetja v kraju Willisburg
Industrije
Distribucija podjetij po industrijah Vera: 16,2 %
industrija: 14 %
Storitve na domu: 10,3 %
Zdravstveno: 8,8 %
Hrana: 8,1 %
Nakupovanje: 8,1 %
Izobraževanje: 6,6 %
Avtomobilizem: 5,9 %
Lepota in zdravilišča: 4,4 %
Finančne storitve: 4,4 %
Drugo: 13,2 %
| Območje Willisburg, Kentucky | 0,541 mi² |
| Število prebivalcev | 289 |
| Moška populacija | 140 (48,4 %) |
| Ženska populacija | 149 (51,6 %) |
| Sprememba prebivalstva z 1975 na 2015 | +71 % |
| Sprememba prebivalstva z 2000 na 2015 | +9,1 % |
| Povprečna starost | 40,1 |
| Povprečna starost moških | 37,1 |
| Povprečna starost žensk | 43 |
| Telefonske Številke | 606, 859 |
| Krajevni čas | nedelja 01:48 |
| Časovni pas | Vzhodni poletni čas |
| Zemlj. šir. in dol. | 37.80979° / -85.12635° |
| Poštne Številke | 40078 |
Willisburg, Kentucky - Zemljevid
Willisburg, Kentucky Prebivalstvo
Leta 1975 do 2015| Podatki | 1975 | 1990 | 2000 | 2015 |
|---|---|---|---|---|
| Število prebivalcev | 169 | 227 | 265 | 289 |
| Gostota prebivalstva | 312,6 / mi² | 419,9 / mi² | 490,2 / mi² | 534,6 / mi² |
Willisburg Sprememba prebivalstva iz 2000 v 2015
Povišanje vrednosti 9,1 % iz leta 2000 na 2015| Kraj | Sprememba od 1975 | Sprememba od 1990 | Sprememba od 2000 |
|---|---|---|---|
| Willisburg, Kentucky | +71 % | +27,3 % | +9,1 % |
| Kentucky | +37,1 % | +20,9 % | +9,9 % |
| Združene države Amerike | +46,9 % | +27,2 % | +13,7 % |
Willisburg, Kentucky srednja doba
Srednja doba: 40,1 let| Kraj | Povprečna starost | Srednja starost (ženska) | Srednja starost (moški) |
|---|---|---|---|
| Willisburg, Kentucky | 40,1 let | 43 let | 37,1 let |
| Kentucky | 38 let | 39,3 let | 36,7 let |
| Združene države Amerike | 37,4 let | 38,7 let | 36,1 let |
Willisburg, Kentucky Populacijsko drevo
Prebivalstvo po starosti in spolu| Starost | Moški | Ženske | Skupaj |
|---|---|---|---|
| Pod 5 | 13 | 5 | 18 |
| 5-9 | 13 | 12 | 25 |
| 10-14 | 16 | 10 | 27 |
| 15-19 | 2 | 6 | 9 |
| 20-24 | 2 | 4 | 6 |
| 25-29 | 6 | 9 | 16 |
| 30-34 | 9 | 16 | 26 |
| 35-39 | 20 | 7 | 28 |
| 40-44 | 5 | 8 | 14 |
| 45-49 | 9 | 3 | 12 |
| 50-54 | 6 | 4 | 11 |
| 55-59 | 8 | 12 | 21 |
| 60-64 | 5 | 7 | 12 |
| 65-69 | 11 | 17 | 29 |
| 70-74 | 11 | 12 | 24 |
| 75-79 | 4 | 4 | 9 |
| 80-84 | 0 | 6 | 6 |
| 85 Plus | 0 | 6 | 6 |
Willisburg, Kentucky Gostota prebivalstva
Gostota prebivalstva: 534,6 / mi²| Kraj | Število prebivalcev | območje | Gostota prebivalstva |
|---|---|---|---|
| Willisburg, Kentucky | 289 | 0,541 mi² | 534,6 / mi² |
| Kentucky | 4,5 milijonov | 40.408 mi² | 110,6 / mi² |
| Združene države Amerike | 321,6 milijonov | 3.796.761,2 mi² | 84,7 / mi² |
Willisburg, Kentucky Zgodovinsko in načrtovano prebivalstvo
Ocenjena populacija od 1750 do 2100Sources:
1. JRC (European Commission's Joint Research Centre) work on the GHS built-up grid
2. CIESIN (Center for International Earth Science Information Network)
3. [Povezava] Klein Goldewijk, K., Beusen, A., Doelman, J., and Stehfest, E.: Anthropogenic land use estimates for the Holocene – HYDE 3.2, Earth Syst. Sci. Data, 9, 927–953, https://doi.org/10.5194/essd-9-927-2017, 2017.
Indeks človekovega razvoja (HDI)
Statistični sestavljeni indeks življenjske dobe, izobrazbe in dohodka na prebivalca.Sources: [Link] Kummu, M., Taka, M. & Guillaume, J. Gridded global datasets for Gross Domestic Product and Human Development Index over 1990–2015. Sci Data 5, 180004 (2018) doi:10.1038/sdata.2018.4
Emisije CO2 Willisburg, Kentucky
Emisije ogljikovega dioksida (CO2) na prebivalca v tonah na leto| Kraj | Emisije CO2 | Emisije CO2 na prebivalca | Intenzivnost izpustov CO2 |
|---|---|---|---|
| Willisburg, Kentucky | 5.499 sh tn | 19 sh tn | 10.174 sh tn/mi² |
| Kentucky | 80.701.117 sh tn | 18,1 sh tn | 1.997 sh tn/mi² |
| Združene države Amerike | 5.664.619.809 sh tn | 17,6 sh tn | 1.491 sh tn/mi² |
Emisije CO2 Willisburg, Kentucky
| 2013 emisije CO2 (tone / leto) | 5.499 sh tn |
| 2013 CO2 emisije (tone / leto) na prebivalca | 19 sh tn |
| Intenzivnost emisij CO2 2013 (tone / mi² / leto) |
Naravne nevarnosti
Relativno tveganje od 10| Poplava | Visoka (7) |
* Tveganja, zlasti v zvezi s poplavami ali plazovom, morda ni za celotno območje.
Sources: 1. Dilley, M., R.S. Chen, U. Deichmann, A.L. Lerner-Lam, M. Arnold, J. Agwe, P. Buys, O. Kjekstad, B. Lyon, and G. Yetman. 2005. Natural Disaster Hotspots: A Global Risk Analysis. Washington, D.C.: World Bank. https://doi.org/10.1596/0-8213-5930-4.
2. Center for Hazards and Risk Research - CHRR - Columbia University, Center for International Earth Science Information Network - CIESIN - Columbia University. 2005. Global Flood Hazard Frequency and Distribution. Palisades, NY: NASA Socioeconomic Data and Applications Center (SEDAC). https://doi.org/10.7927/H4668B3D.
Nedavni potresi v bližini
Magnitude 3.0 in več
O naših podatkih
Podatki na tej strani so ocenjeni z uporabo številnih javno dostopnih orodij in virov. Na voljo je brez garancije in lahko vsebuje netočnosti. Uporabljajte na lastno odgovornost. Glej tukaj za več informacij.