Kategorije v kraju Celendín
AvtomehanikaPopravilo in vzdrževanje avtomobilovCerkveJavno središčeStanovanjska dejavnostIzobraževalni centerIzobraževanjeTuristična znamenitostBari, pubi in taverneRestavracijeRestavracije s hitro hranoTrgovine z živili in supermarketiBankeStanovanjski kompleksLekarnaNakupovanje drugoJavni parkiHoteli in moteli
Industrije
Porazdelitev podjetij po panogah v Celendín
Dejstva o Celendín
| območje | 330.7 km² |
| Število prebivalcev | 26.008 |
| Moška populacija | 12.508 (48.1%) |
| Ženska populacija | 13.500 (51.9%) |
| Sprememba prebivalstva (1975 to 2020) | +91.0% |
| Sprememba prebivalstva (2000 to 2020) | +8.8% |
| Povprečna starost | 23.2 let (Moški: 22.5, Ženske: 23.9) |
| GDP na prebivalca (PPP) | $5617 (2022) |
| Krajevni čas | |
| Časovni pas | Perujski standardni čas |
| Zemlj. šir. in dol. | -6.86590, -78.14585 |
| Poštne Številke | 06226 |
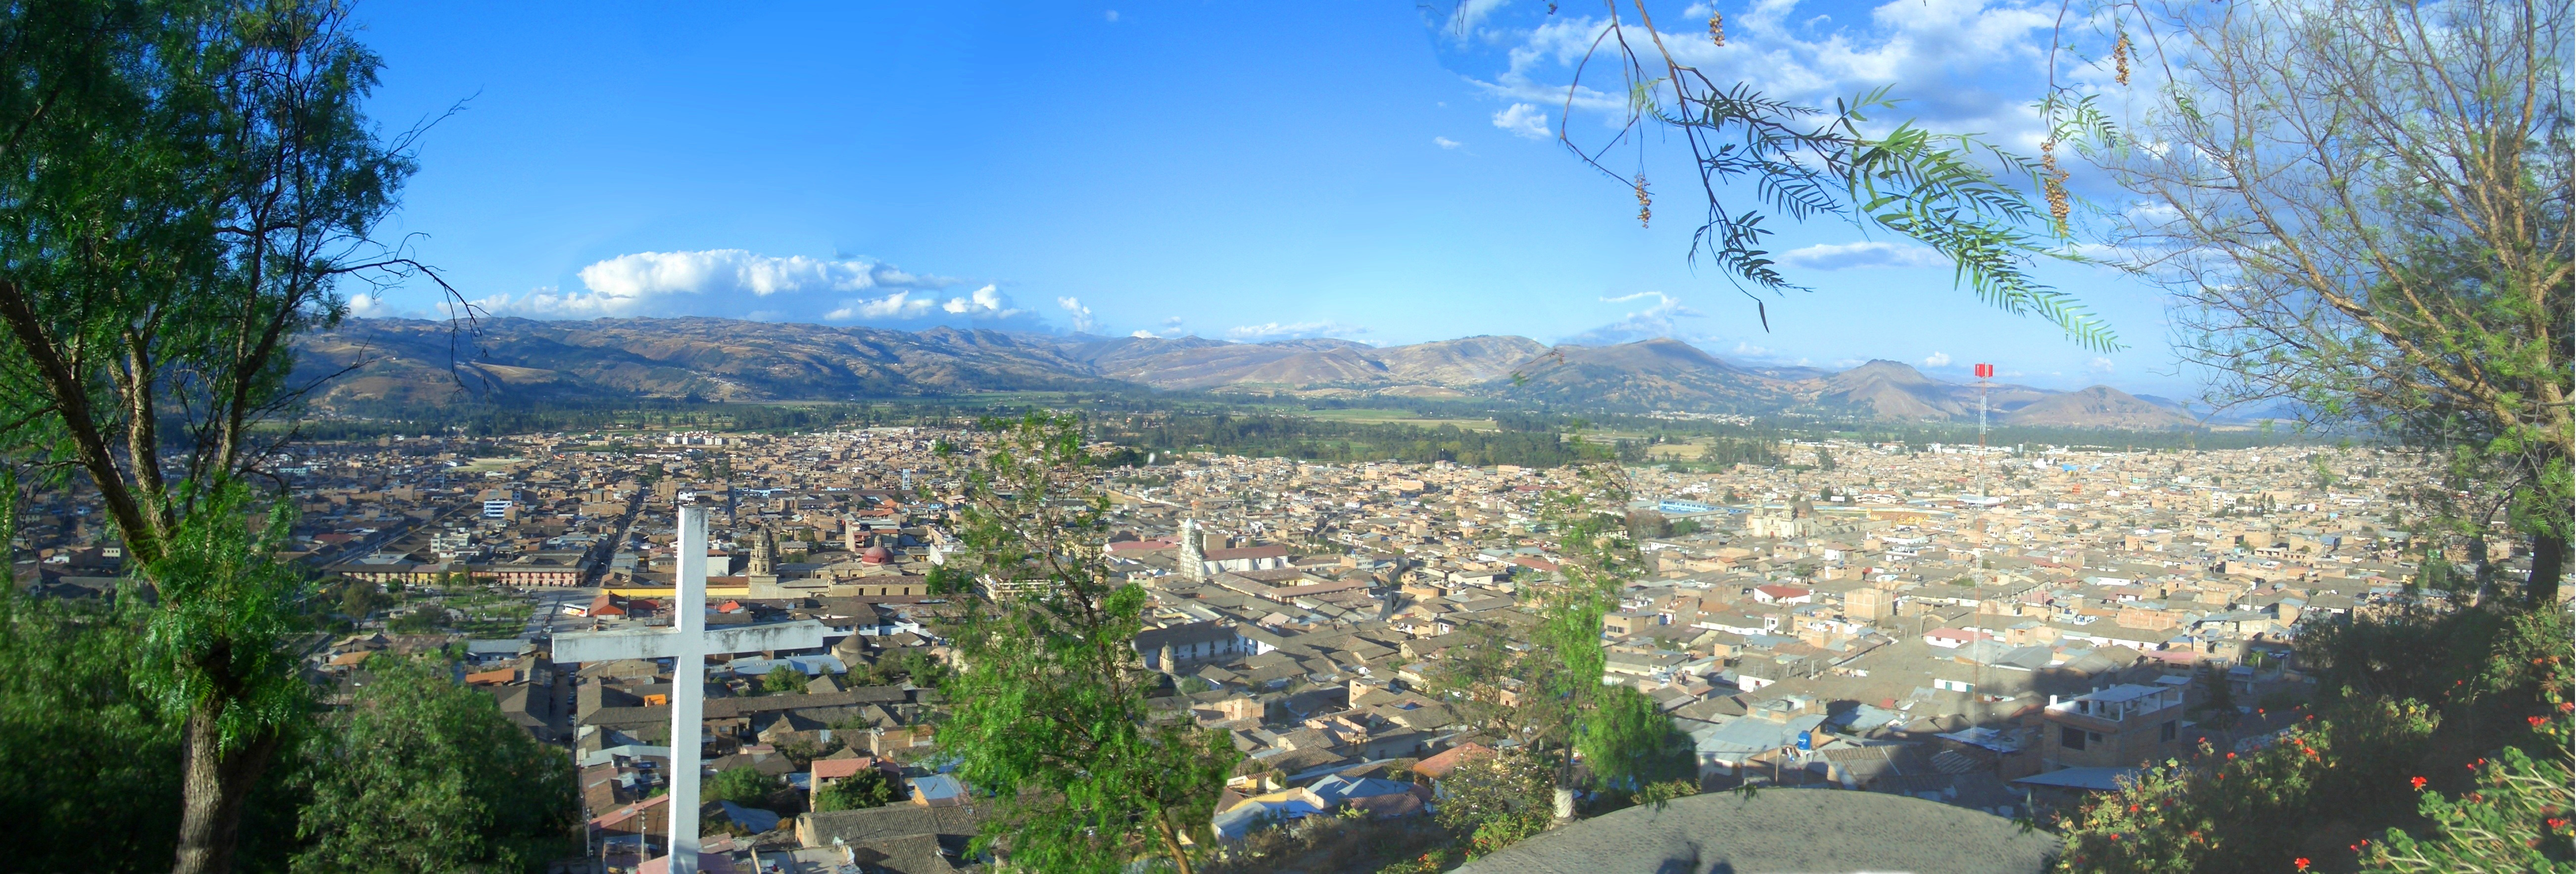
Zemljevid Celendín
Interaktivni zemljevid
Prebivalstvo Celendín
Leta 1975 do 2030
| Data | 1975 | 1990 | 2000 | 2015 | 2020 | 2025* | 2030* |
|---|---|---|---|---|---|---|---|
| Število prebivalcev | 13.615 | 20.397 | 23.914 | 26.607 | 26.008 | 26.067 | 26.094 |
| Gostota prebivalstva | 41,2 / km² | 61,7 / km² | 72,3 / km² | 80,5 / km² | 78,6 / km² | 78,8 / km² | 78,9 / km² |
* Napovedano
Viri: JRC (European Commission's Joint Research Centre) delajo na Mreža pozidanih površin GHSSprememba prebivalstva Celendín od 2000 do 2020
Povečanje za 8.8% od leta 2000 do 2020
| Kraj | Sprememba od 1975 | Sprememba od 1990 | Sprememba od 2000 |
|---|---|---|---|
| Celendín | +91% | +27.5% | +8.8% |
| Cajamarca | — | — | — |
| Peru | — | — | — |
Viri: JRC (European Commission's Joint Research Centre) delajo na Mreža pozidanih površin GHS
Mediana starosti Celendín
Mediana starosti: 23.2 let
| Kraj | Povprečna starost | Srednja starost (ženska) | Srednja starost (moški) |
|---|---|---|---|
| Celendín | 23.2 yrs | 23.9 yrs | 22.5 yrs |
| Cajamarca | 22.8 yrs | 23.3 yrs | 22.3 yrs |
| Peru | 25.1 yrs | 25.6 yrs | 24.6 yrs |
Viri: CIESIN (Center for International Earth Science Information Network)
Gostota prebivalstva Celendín
Gostota prebivalstva: 78,6 / km²
| Kraj | Število prebivalcev | območje | Gostota |
|---|---|---|---|
| Celendín | 26.008 | 330,7 km² | 78,6 / km² |
| Cajamarca | 1,5 million | 32.940,7 km² | 44,4 / km² |
| Peru | 31 million | 1.291.975 km² | 24 / km² |
Viri: JRC (European Commission's Joint Research Centre) delajo na Mreža pozidanih površin GHS
Zgodovinsko in napovedano prebivalstvo Celendín
Ocenjeno prebivalstvo od 0 do 2100
Viri:
- JRC (European Commission's Joint Research Centre) delajo na GHS built-up grid
- CIESIN (Center for International Earth Science Information Network)
- [Povezava] Klein Goldewijk, K., Beusen, A., Doelman, J., and Stehfest, E.: Anthropogenic land use estimates for the Holocene – HYDE 3.2, Earth Syst. Sci. Data, 9, 927–953, https://doi.org/10.5194/essd-9-927-2017, 2017.
Indeks človekovega razvoja (HDI)
Statistični sestavljeni indeks življenjske dobe, izobrazbe in dohodka na prebivalca.
Vir: [Povezava] Kummu, M., Taka, M. &Guillaume, J. Gridded global datasets for Gross Domestic Product and Human Development Index over 1990–2015. Sci Data 5, 180004 (2018) doi:10.1038/sdata.2018.4
Bruto domači proizvod (GDP) mesta Celendín
GDP na prebivalca, PPP (stalni mednarodni dolarji iz leta 2017)
| Data | 1990 | 1995 | 2000 | 2005 | 2010 | 2015 | 2020 | 2022 |
|---|---|---|---|---|---|---|---|---|
| GDP na prebivalca | $2329 | $3213 | $3826 | $5129 | $7344 | $7950 | $4954 | $5617 |
| Skupni GDP | $48,1 mio. | $73,6 mio. | $96,6 mio. | $132,5 mio. | $185,5 mio. | $197,6 mio. | $130,3 mio. | $147,9 mio. |
Vir: [Povezava] Kummu, M., Kosonen, M. & Masoumzadeh Sayyar, S. Downscaled gridded global dataset for gross domestic product (GDP) per capita PPP over 1990–2022. Sci Data 12, 178 (2025) doi:10.1038/s41597-025-04487-x
Emisije CO2 Celendín
Emisije ogljikovega dioksida (CO2) na prebivalca v tonah na leto
| Kraj | Emisije CO2 | Emisije CO2 na prebivalca | Intenzivnost izpustov CO2 |
|---|---|---|---|
| Celendín | 53,341 tn | 2.05 tn | 161.3 tons/km² |
| Cajamarca | 2,997,835 tn | 2.05 tn | 91 tons/km² |
| Peru | 71,626,946 tn | 2.31 tn | 55.4 tons/km² |
Viri: [Povezava] Moran, D., Kanemoto K; Jiborn, M., Wood, R., Többen, J., and Seto, K.C. (2018) Ogljični odtisi 13.000 mest. Environmental Research Letters DOI: 10.1088/1748-9326/aac72a
Emisije CO2 Celendín
| Emisije CO2 leta 2013 (ton/leto) | 53,341 tn |
| Emisije CO2 leta 2013 (ton/leto) na prebivalca | 2.05 tn |
| Intenzivnost emisij CO2 leta 2013 (ton/km²/leto) | 161.3 tons/km² |
Naravne nevarnosti
Relativno tveganje od 10
| Nevarnost | Stopnja tveganja |
|---|---|
| Suša | Nizka (2) |
| Poplava | Srednja (7) |
| Potres | Srednja (7) |
| Plaz | Srednja (7) |
* Tveganja, zlasti v zvezi s poplavami ali plazovom, morda ni za celotno območje.
Viri:
- Dilley, M., R.S. Chen, U. Deichmann, A.L. Lerner-Lam, M. Arnold, J. Agwe, P. Buys, O. Kjekstad, B. Lyon, and G. Yetman. 2005. Natural Disaster Hotspots: A Global Risk Analysis. Washington, D.C.: World Bank. https://doi.org/10.1596/0-8213-5930-4.
- Center for Hazards and Risk Research - CHRR - Columbia University, Center for International Earth Science Information Network - CIESIN - Columbia University, and Norwegian Geotechnical Institute - NGI. 2005. Global Landslide Hazard Distribution. Palisades, NY: NASA Socioeconomic Data and Applications Center (SEDAC). https://doi.org/10.7927/H4P848VZ.
- Center for Hazards and Risk Research - CHRR - Columbia University, Center for International Earth Science Information Network - CIESIN - Columbia University, and International Research Institute for Climate and Society - IRI - Columbia University. 2005. Global Drought Hazard Frequency and Distribution. Palisades, NY: NASA Socioeconomic Data and Applications Center (SEDAC). https://doi.org/10.7927/H4VX0DFT.
- Center for Hazards and Risk Research - CHRR - Columbia University, Center for International Earth Science Information Network - CIESIN - Columbia University. 2005. Global Flood Hazard Frequency and Distribution. Palisades, NY: NASA Socioeconomic Data and Applications Center (SEDAC). https://doi.org/10.7927/H4668B3D.
- Center for Hazards and Risk Research - CHRR - Columbia University, Center for International Earth Science Information Network - CIESIN - Columbia University. 2005. Global Earthquake Hazard Distribution - Peak Ground Acceleration. Palisades, NY: NASA Socioeconomic Data and Applications Center (SEDAC). https://doi.org/10.7927/H4BZ63ZS.
Nedavni potresi v bližini
Magnitude 3.0 in več
| Datum▼ | Čas↕ | Magnitude↕ | Distance↕ | Globina↕ | Kraj↕ | Povezava |
|---|---|---|---|---|---|---|
| 4/11/05 | 2:54 PM | 6 | 55.3 km | 129,900 m | northern Peru | usgs.gov |
| 12/1/98 | 2:55 PM | 4.5 | 68.5 km | 33,000 m | northern Peru | usgs.gov |
| 6/20/94 | 10:02 AM | 4.6 | 2.6 km | 125,000 m | northern Peru | usgs.gov |
| 8/30/85 | 4:44 AM | 4.3 | 92.4 km | 33,000 m | northern Peru | usgs.gov |
| 7/30/79 | 1:43 PM | 4.6 | 22.3 km | 33,000 m | northern Peru | usgs.gov |
| 5/20/79 | 1:43 AM | 5.7 | 94.3 km | 33,000 m | northern Peru | usgs.gov |
| 3/5/74 | 12:55 AM | 4 | 66 km | 235,000 m | northern Peru | usgs.gov |

O naših podatkih
Podatki na tej strani so ocenjeni z uporabo številnih javno dostopnih orodij in virov. Zagotovljeni so brez jamstva in lahko vsebujejo netočnosti. Uporabljajte na lastno odgovornost.